This guide will instruct you to visualize data in Easy LoRaWAN Cloud.
- Easy LoRaWAN UI: https://ui.easylorawan.com
- Easy LoRaWAN Server: https://lorawan.easylorawan.com
1. Check all steps
Step 1.1: You MUST complete guides 1 and 2 in Easy LoRaWAN – Quickstart.
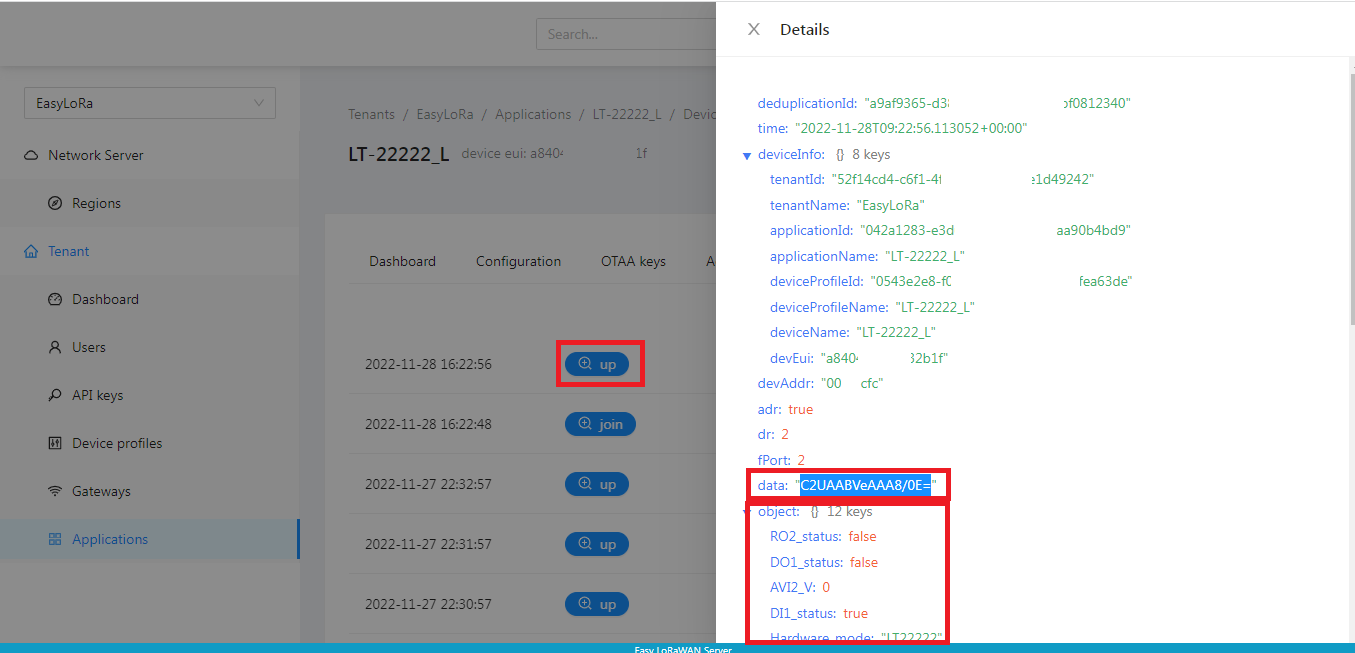
Step 1.2: In LoRaWAN Server, to check for data field in “up” packets.
- The data field must be populated as hex string.
- The object field must be polulated by the server as a JSON object.
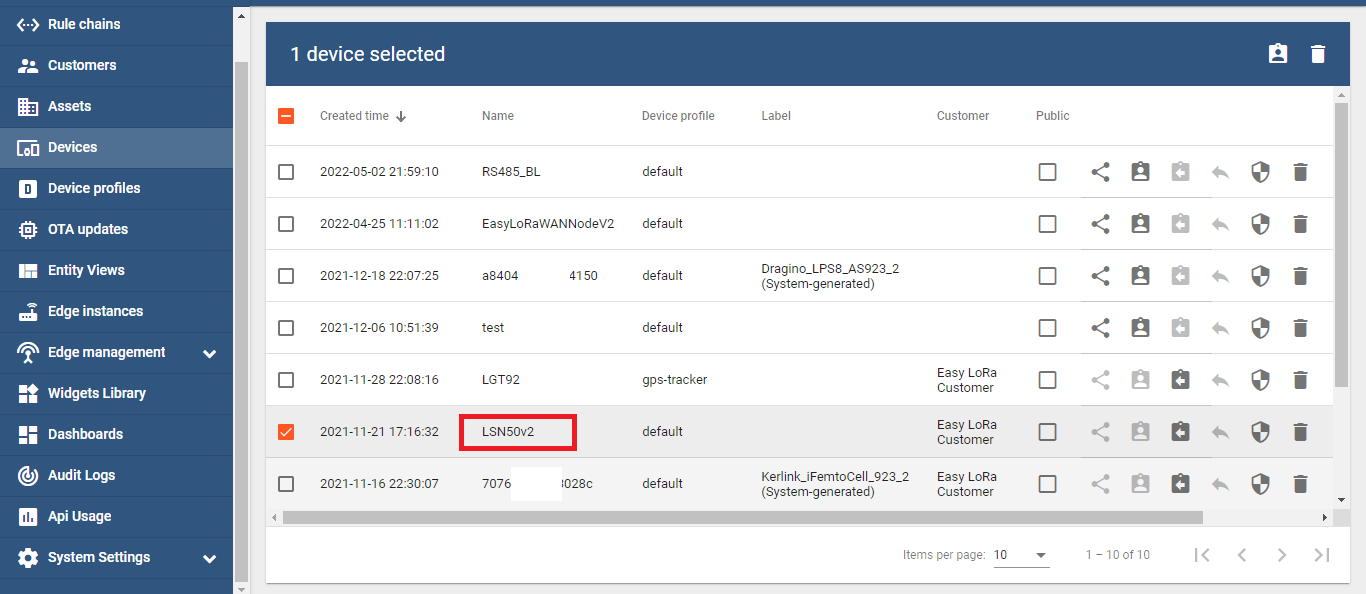
Step 1.3: In UI Server, the LoRaWAN node should be automatically created when it sends data to the Easy LoRaWAN cloud via a LoRaWAN gateway.
Step 1.4: We should see the uploaded data from JSON object in Step 1.2.
2. Visualize data
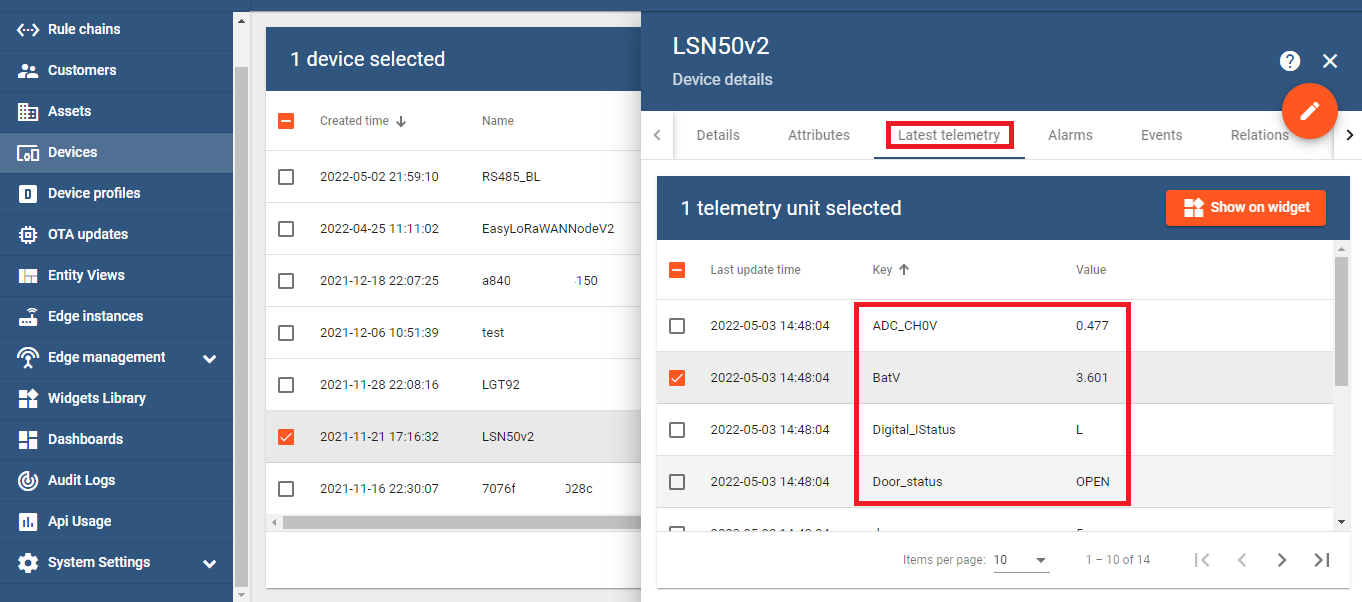
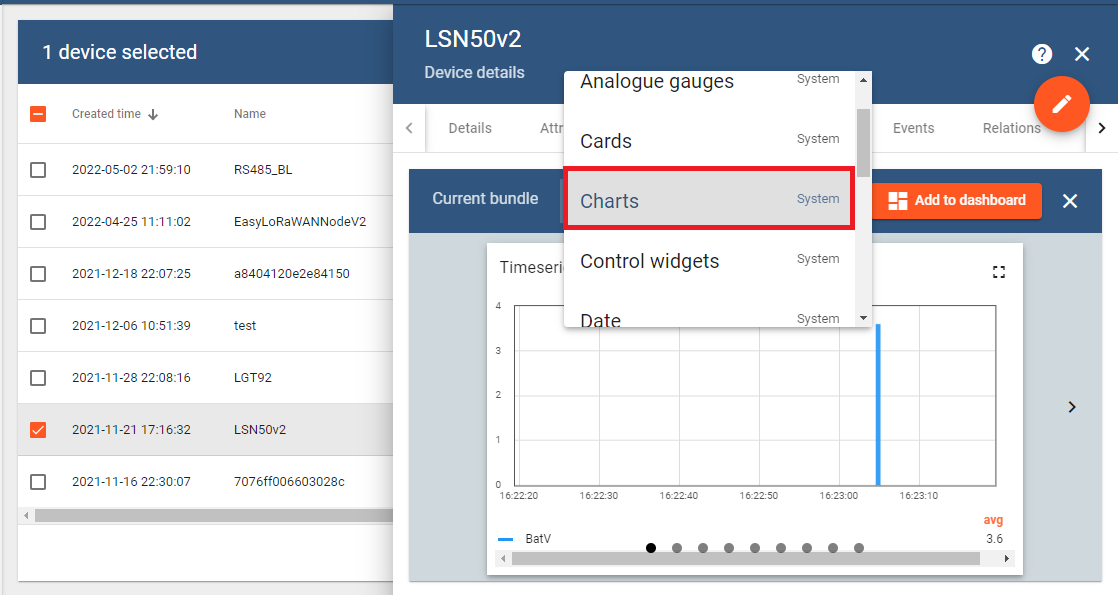
Step 2.1: To select on 1 telemetry and click on “Show on Widget”.
- Analogue gauges: To show sensor value in analogue styles.
- Digital gauges: To show sensor value in digital styles.
- Charts: To show sensor value in bar and line graphs

Step 2.2: To select a bundle to visualize data and click “Add to dashboard”
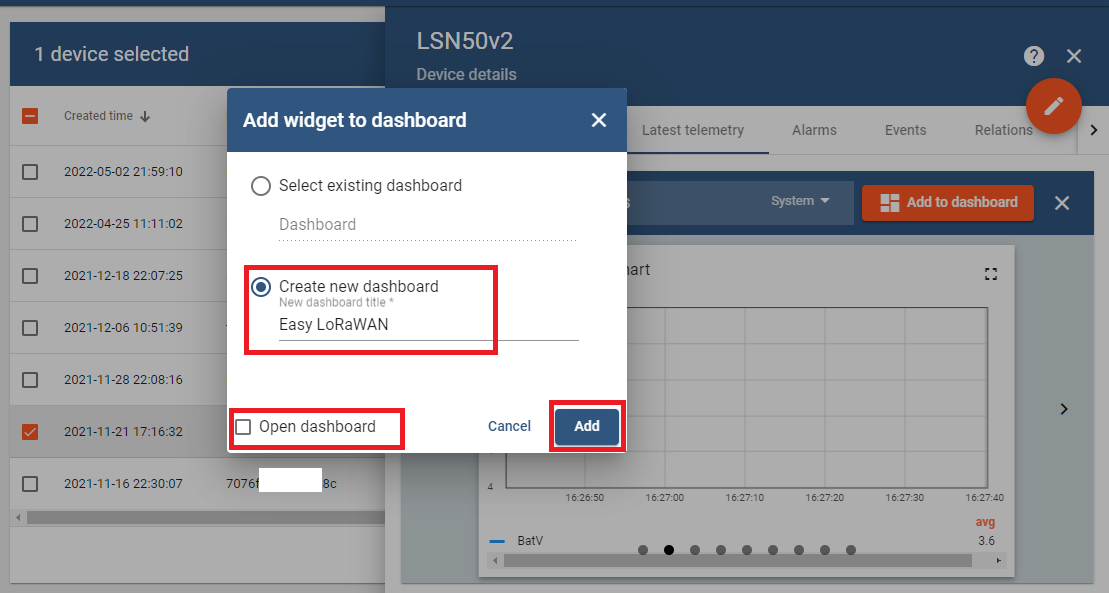
Step 2.3: To add the widget into dashboard.
- To “Create a new dashboard” if we do not have any dashboard yet.
- To “Select existing dashboard” if we want to add the widget into an existing dashboard.
- To check “Open dashboard” if we want to go to the dashboard after we add the widget.
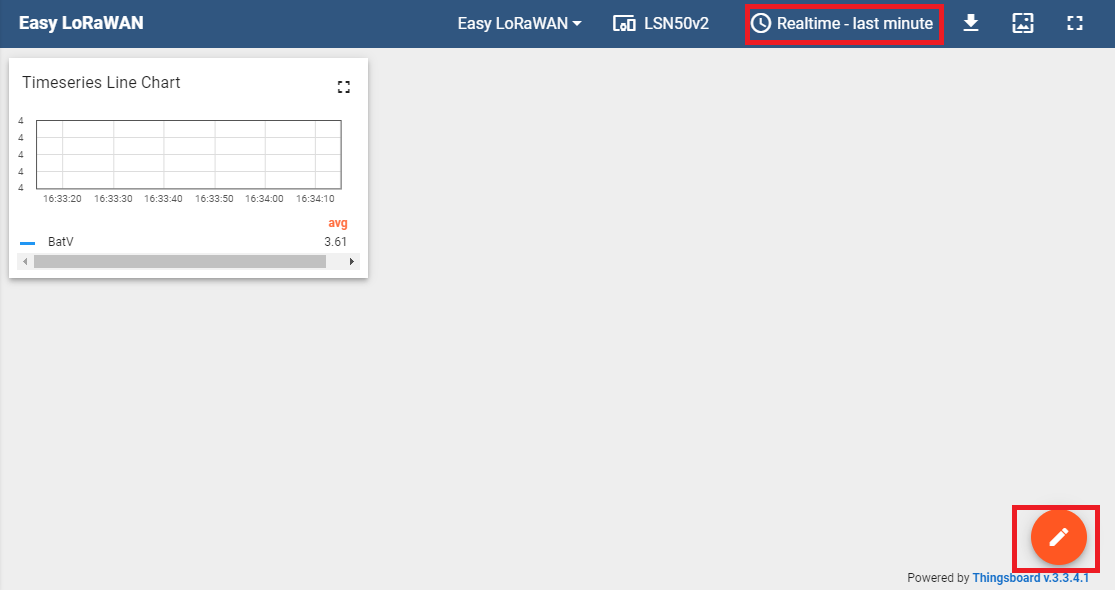
Step 2.4: To select time range and edit the dashboard.
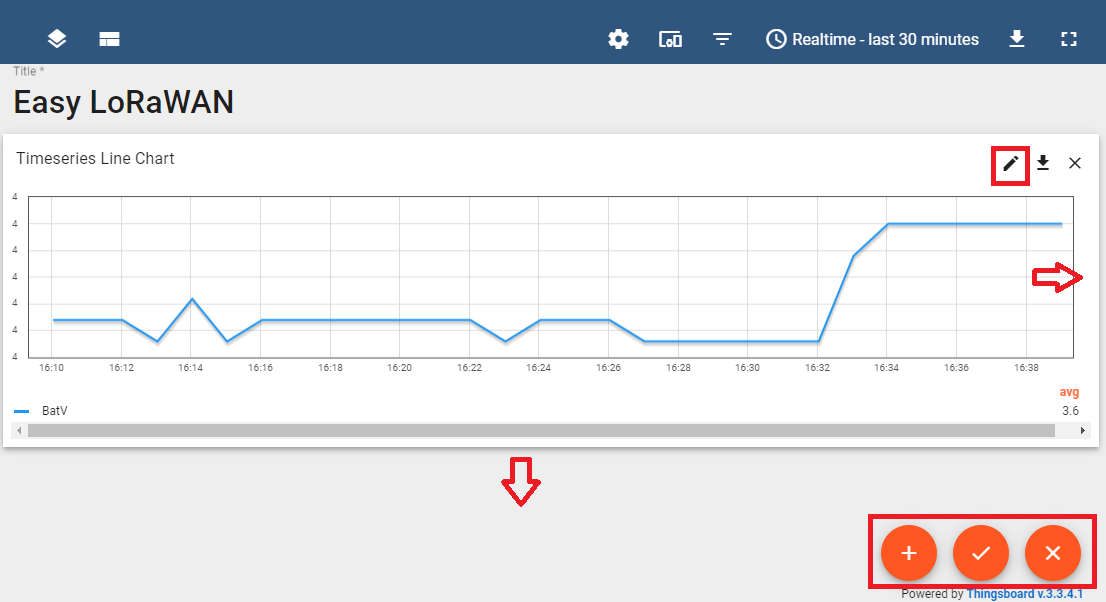
Step 2.5: To edit the widget as we want.
- We can resize and move the widget
- We can edit the widget
- We can add new widgets, save changes or cancel saving the dashboard.
Done.
Need help for your projects?
Please chat with us on the red chatbox to get help or discuss about your projects.
Thanks for reaching us.


How can I customize the dashboard on the mobile app?
Hi Karl,
You can modify in the web GUI.
The change will apply to the dashboards in the mobile app.
Is the mobile app included in the Explorer plan?
Sure, it is included in all plans.
The mobile app is one of our unique features compared to other LoRaWAN Clouds.